The living room vs the bedroom.
The Living Room is money spent on what others see — weddings, funerals, fashion, gifts. The Bedroom is money spent on what builds you — savings, education, housing. In nine of Africa’s ten biggest economies, the Living Room wins. Here’s the whole story in plain language — fact-checked.
Section 01The Two Rooms
Picture every shilling, naira or cedi a household spends flowing into one of two rooms:
- The Living Room — money spent on what others see. Weddings. Funerals. Fashion. Gifts. The status economy.
- The Bedroom — money spent on what builds you. Savings. Education. A house. A pension. The wealth economy.
The question this report answers: which room gets more money?
The answer explains a puzzle you’ve probably felt personally: how some of the hardest-working, most community-rich societies on earth end up passing down so little wealth from one generation to the next.
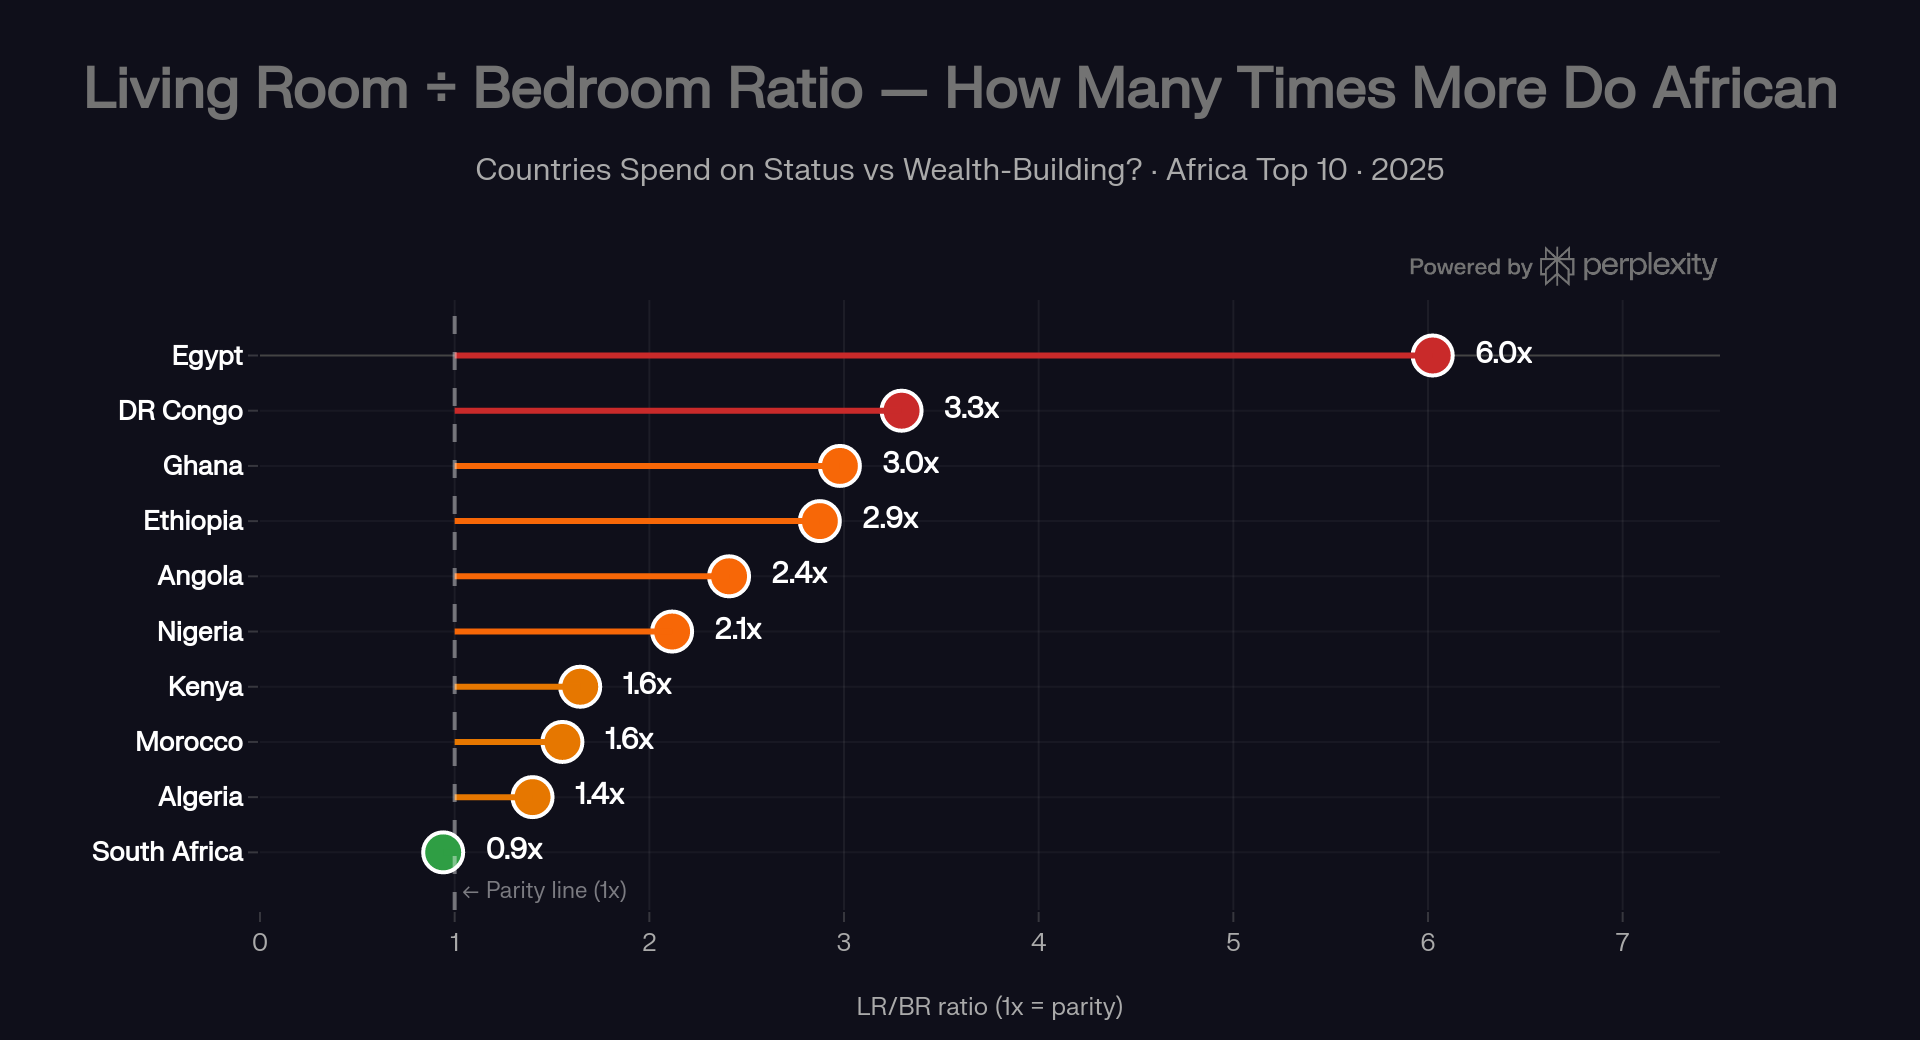
In nine of Africa’s ten biggest economies, the Living Room gets 1.4 to 6 times more money than the Bedroom. Only South Africa comes out roughly even.
Quick honesty note: the percentages in these charts are a comparison index — once-a-decade ceremonies spread over ten years — not literal household budgets. Read them for ranking, not decimals. Full explanation in Section 09.
Section 02The Master Comparison
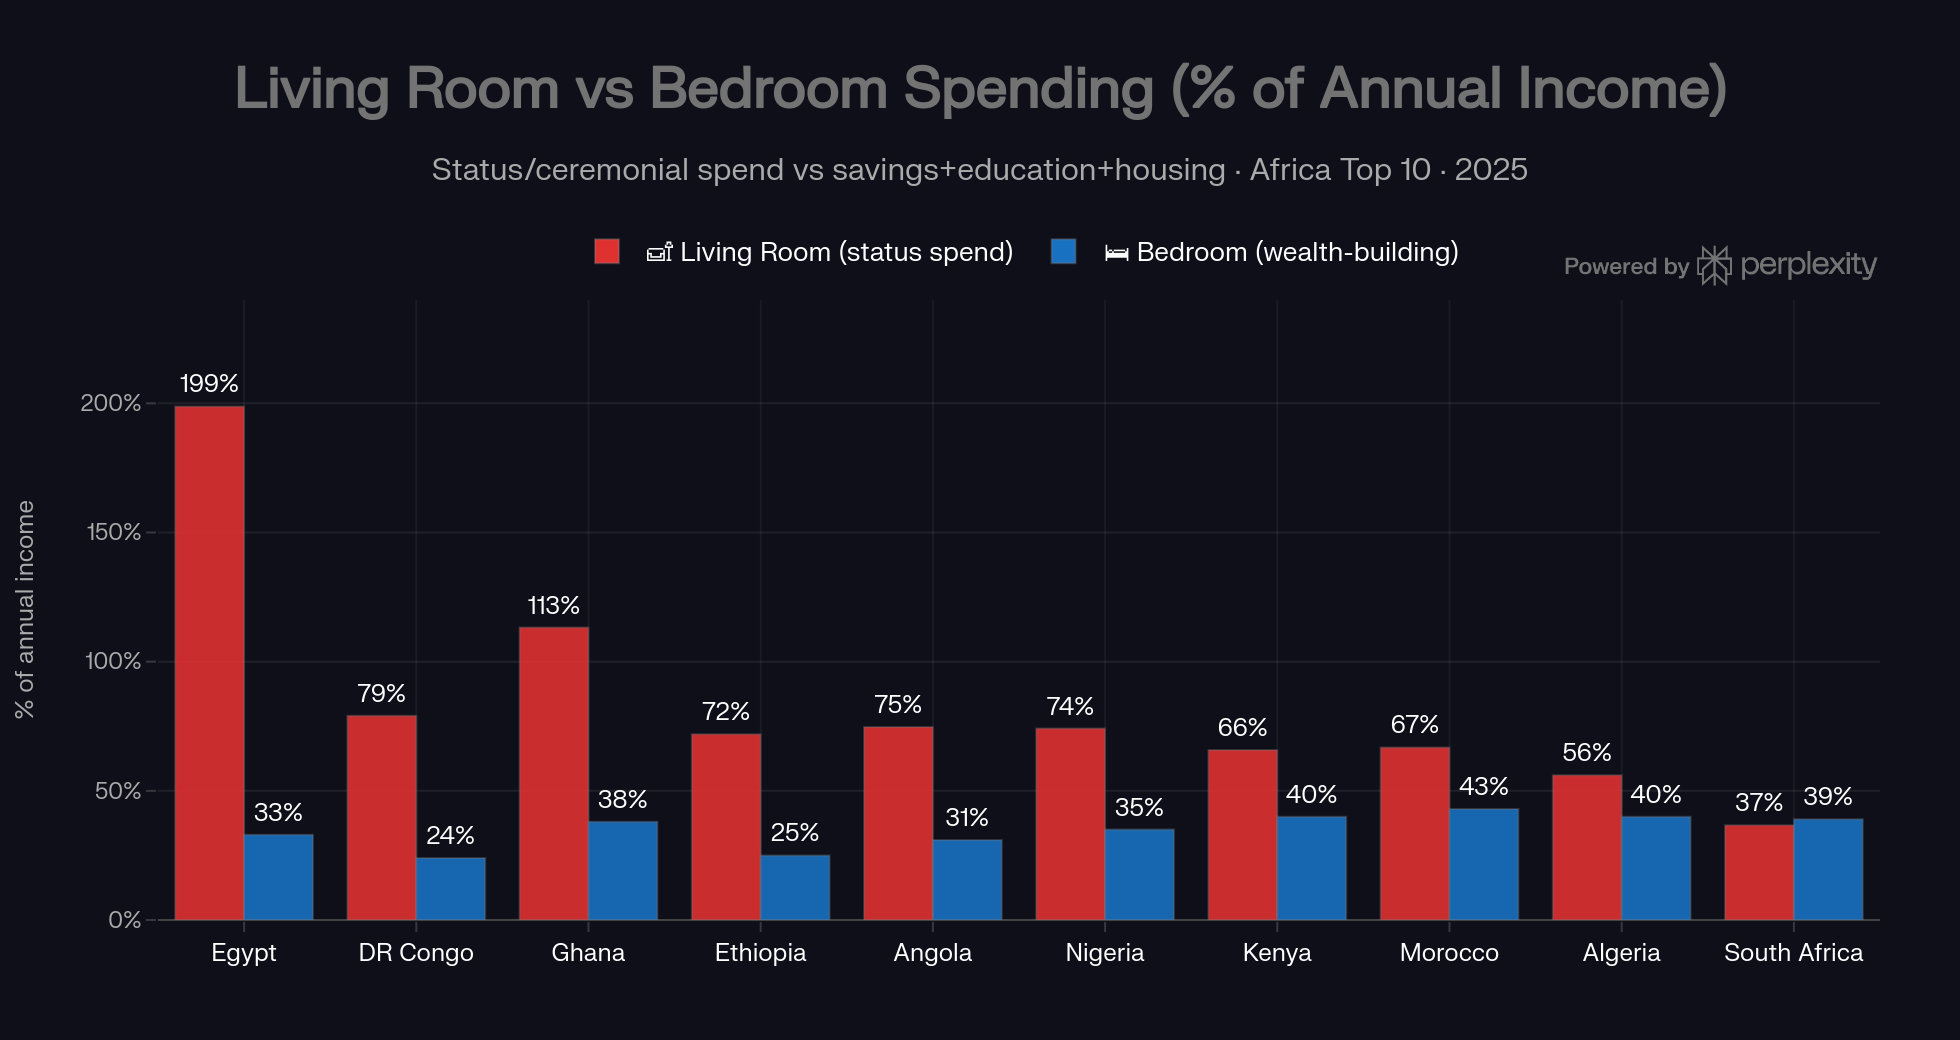
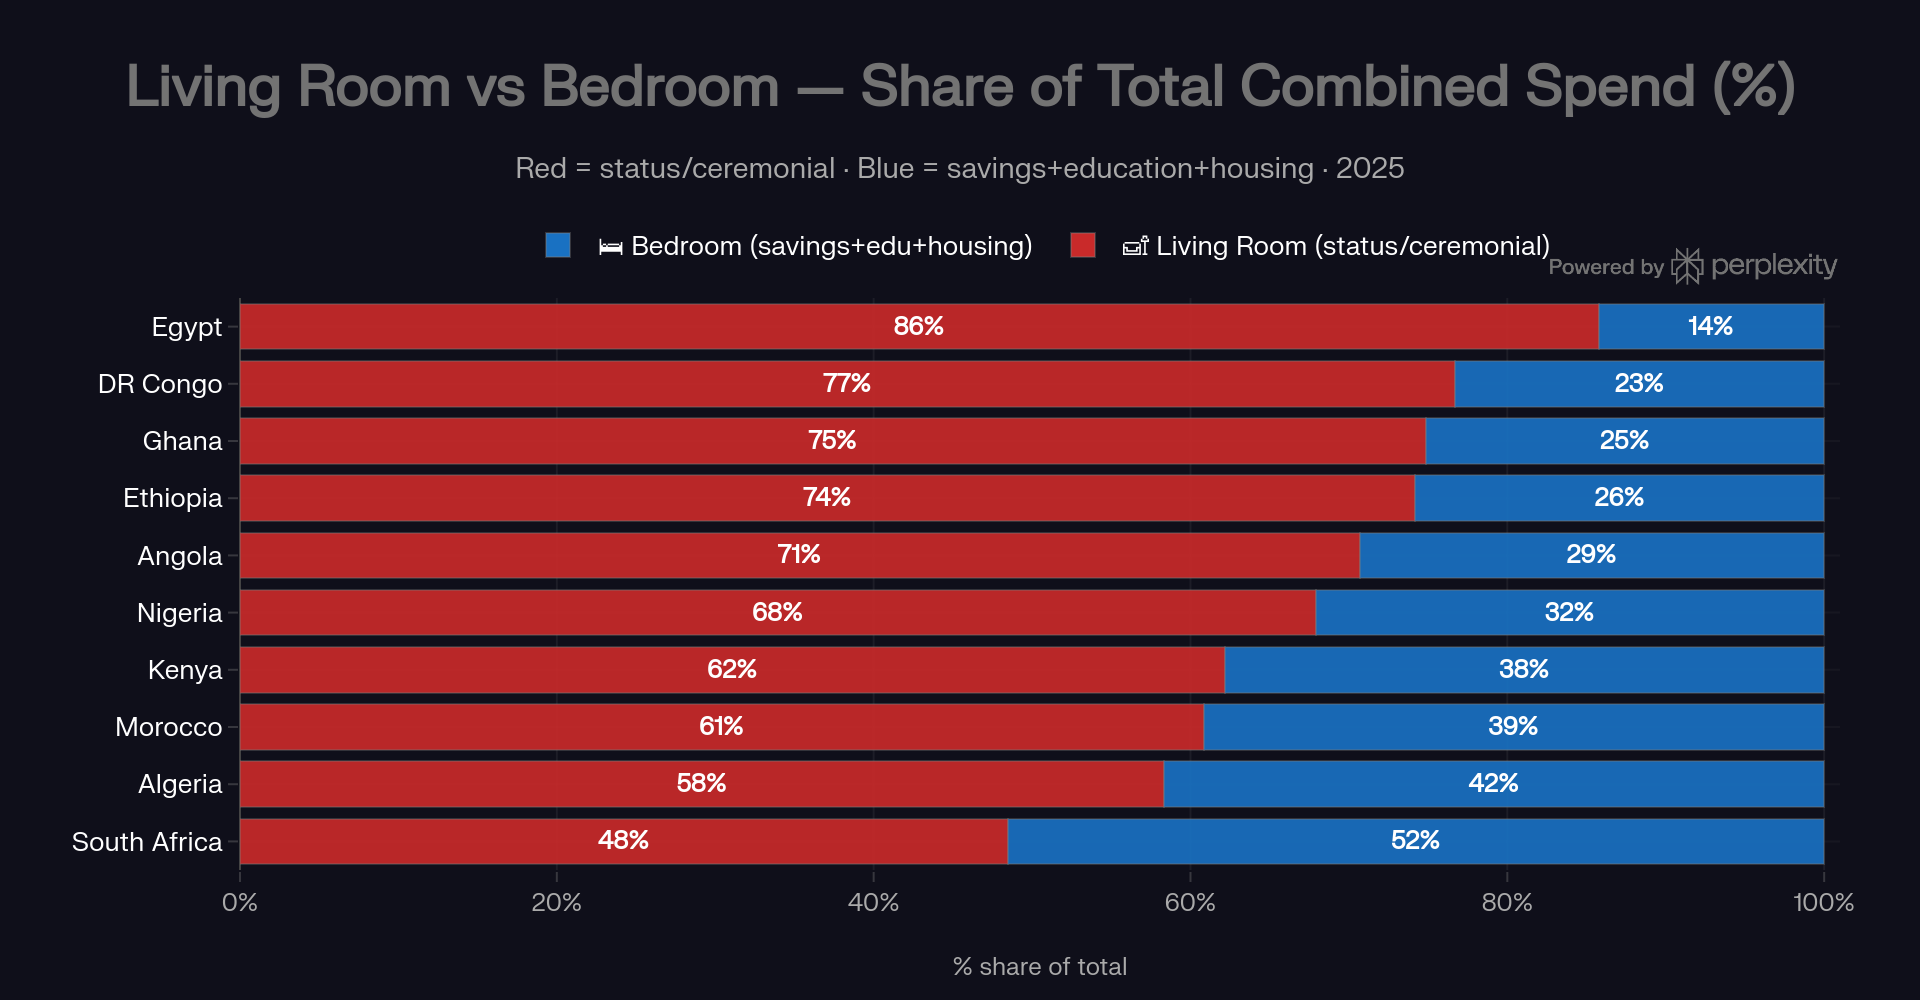
Read Fig 2 like this: take every pound, cedi or naira that goes into either room. In Egypt, 86 of every 100 go to the Living Room. In Ghana, 75. In Nigeria, 68. Only in South Africa does the Bedroom get the bigger share — and only just.
Section 03The Ratio, Country by Country
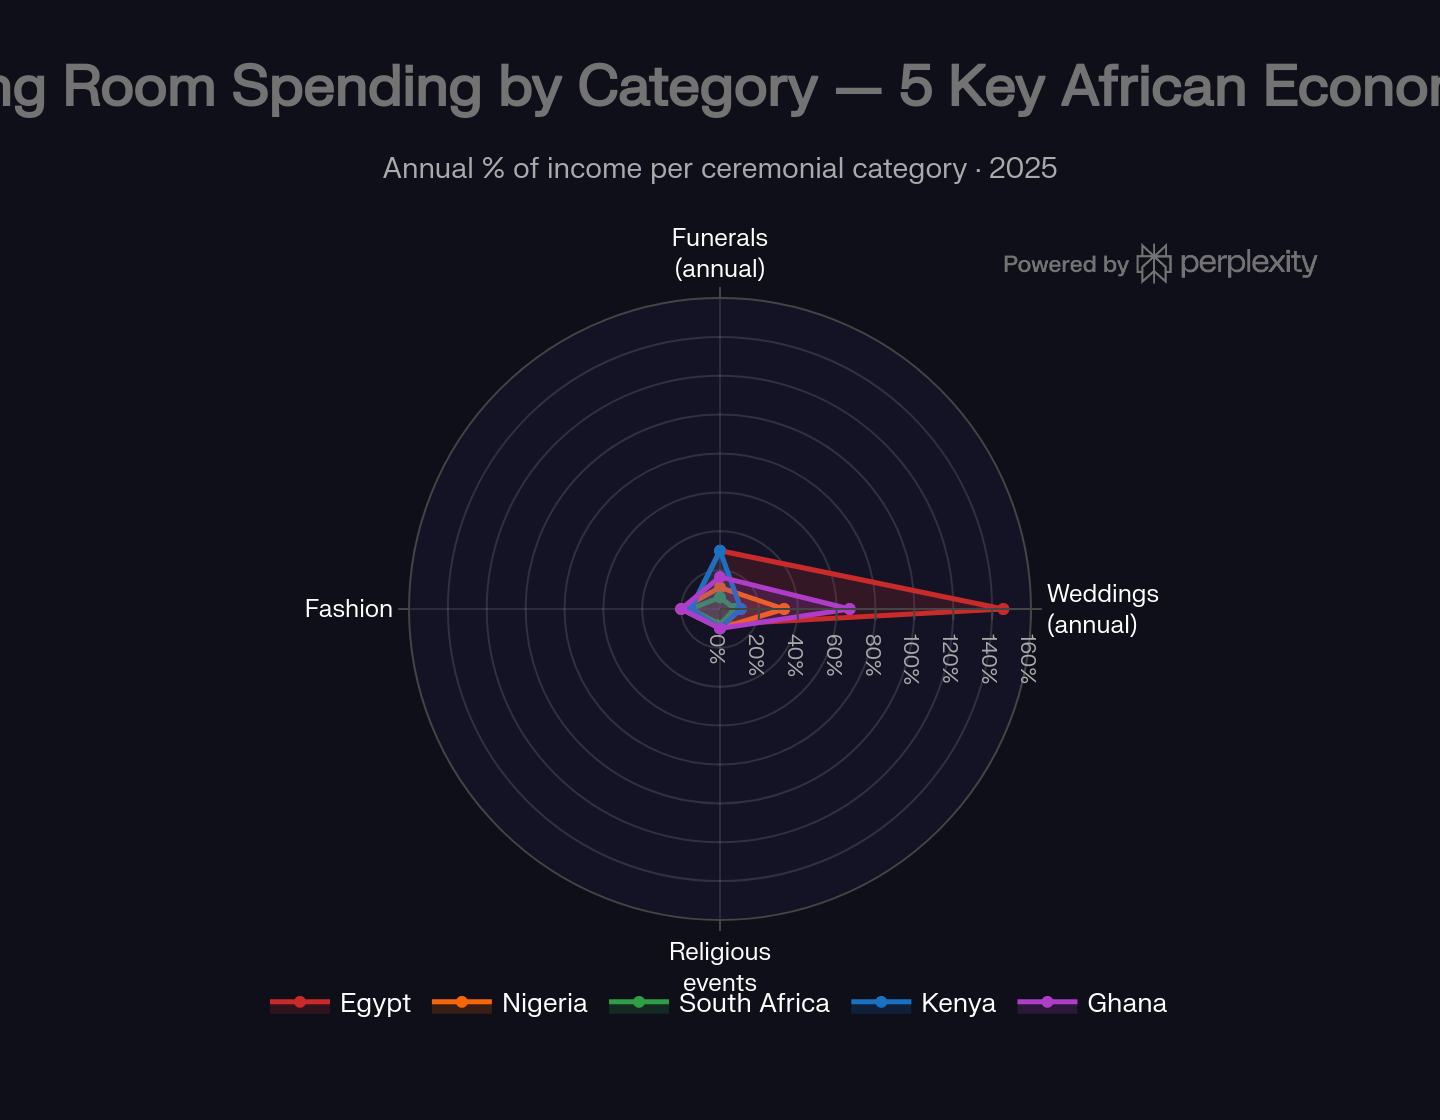
One detail worth noticing in Fig 4: weddings are the biggest Living Room expense everywhere, funerals second. Both are events you can see coming years ahead — which means both can be saved for in advance instead of paid for in debt. Hold that thought for Section 09.
Section 04The Extremes: Egypt, Ghana, Nigeria
Egypt — the most extreme (6×)
An Egyptian groom is expected to provide the shabka (gold for the bride, $5,000–$10,000 on its own), the wedding, and usually an apartment. Then the pound lost 70% of its value, and every one of those obligations repriced upward while wages stood still.
The result: Egypt has the top ten’s highest status burden and its lowest savings rate (9.3% of GDP). And people are responding the only way they can — by not marrying: marriages fell 2.5% last year while divorces rose 3.1% (CAPMAS 2024). It’s now a national policy debate.
Ghana — weddings plus funerals (3×)
A Ghanaian wedding costs GHS 200,000–300,000 — most of a year’s income in one day. Then add West Africa’s famous multi-day funerals, which can cost up to a year’s income again. Meanwhile Accra property prices are so far beyond local wages that home ownership is basically impossible without family money or diaspora help. The same money that funds one big wedding could fund a mortgage deposit.
Nigeria — the owambe paradox (2.1×)
Here’s the paradox in one sentence: Nigeria throws ₦13 million weddings while having one of the lowest home-ownership rates in Africa.
Lagos property costs 21–28 years of average income — nearly impossible without decades of saving. Yet the money that could start that saving keeps flowing into owambe. Every ₦13 million wedding is a property deposit that was never made.
Section 05The Bedroom Leaders: South Africa, Kenya, Algeria & Morocco
Four countries do better — and each one shows a different piece of what “better” requires:
- South Africa (0.9× — the only near-even country). Why? Pensions worth 80%+ of GDP, the continent’s most affordable property relative to income, and — crucially — funeral insurance and burial societies that let families pre-save for ceremonies instead of borrowing for them.
- Kenya (1.6×). The mobile-money effect: 90% of adults have an account — the highest in Sub-Saharan Africa — and M-Shwari/Sacco saving actually works for ordinary earners. The weddings are still heavy; the savings rails at least exist.
- Algeria (1.4×). Higher wages and a real state safety net — which shrinks the need to buy “community insurance” through ceremonies.
- Morocco (1.6×). Higher incomes, moderate ceremony costs. (One fix from our fact-check: financial inclusion there is ~42–58% of adults, not the 81% originally claimed.)
Section 06Where Poverty Amplifies It: Ethiopia, Angola, DR Congo
At the bottom of the income table, the math turns brutal. A $2,200 Ethiopian wedding sounds modest — until you divide it by a $51 monthly salary. Angola adds the alambamento bride-price layer before the reception even starts. And DR Congo (the weakest data of the ten — rough estimate) pairs $2,500 weddings with $40 monthly wages.
The DR Congo line is worth sitting with: the country holds a dominant share of the world’s cobalt, yet its people earn under $600 a year — and status obligations consume what little surplus exists. When income is this low, the Living Room doesn’t just outspend the Bedroom. It empties it.
Section 07Why the Living Room Wins: The Incentive Structure
Nobody is being foolish here. The Living Room wins for five very rational reasons:
- It IS the insurance. No pension? No unemployment benefit? Then your community is your safety net — and generosity at weddings and funerals is the premium you pay into it.
- It’s your credit score. Where formal records are weak, a well-fed ceremony tells everyone your family is good for it.
- The diaspora raises the bar. Part of the ~$95bn sent home each year funds ceremonies relatives abroad can’t attend but are expected to sponsor — and every diaspora-funded wedding lifts the local standard for everyone else.
- Saving looks like losing. When a bank account loses to 20% inflation but a wedding visibly buys respect, spending feels smarter.
- Social media never lets the bar drop. Every Lagos, Accra and Nairobi wedding on TikTok becomes someone else’s minimum.
Section 08What the Bedroom Is Not Building
Every year the Living Room wins, four things quietly don’t happen:
- The house doesn’t get bought. The wedding is the deposit that was never made.
- The pension doesn’t get built. Outside South Africa, the continent is ageing without retirement savings — so today’s ceremony spending becomes tomorrow’s burden on the children. The insurance logic, inverted.
- The education gets postponed. Ugandan couples with wedding debt measurably cut school fees and business investment to service it (Section 09).
- The remittances get consumed. Most of the ~$95bn the diaspora sends home is spent, not invested. Shifting even part of it to land, school funds and business equity would change the continent’s trajectory.
Section 09The Fact-Check: Verified, Corrected, Added
We don’t publish numbers we haven’t checked. Before this went live, AGF re-verified the analysis against primary sources. Here’s the honest scorecard (full annex in the PDF):
Verified
- Kenya’s 90% account ownership (Findex 2025); Nigeria’s 20+ point inclusion jump; South Africa’s pension depth; the $95bn remittance flow; the wedding inputs match our Price of “I Do” fact-check.
- The funeral layer is real and measured: Case, Garrib, Menendez & Olgiati (“Paying the Piper”, NBER/EDCC) tracked 3,751 deaths in KwaZulu-Natal — an adult’s funeral costs roughly a year’s income, and ~25% of households borrowed to pay for it.
Corrected
- Morocco’s financial inclusion: ~42–58% of adults (Findex 2025 / Bank Al-Maghrib 2024), not 81% as originally stated.
- Egypt’s marriage rate: ~8.7 per 1,000 (CAPMAS 2024), not 6.1 — the decline itself (−2.5% y/y, divorces +3.1%) is confirmed.
- The headline percentages are an index, not literal budget shares — they annualise middle-class ceremony costs against average wages. The ranking is robust (it matches our independently compiled months-of-salary table); the absolute numbers should not be quoted as household budgets.
Added — evidence that makes the case stronger
- Uganda proved the mechanism. Researchers there measured it: weddings cost 15.5 months of income, 76% of couples end up in debt — and the strongest predictor of spending wasn’t income. It was social pressure. That’s the Living Room thesis, measured.
- The fix already works somewhere. South Africa’s burial societies pre-fund funerals instead of debt-funding them. The missing product is the same thing for weddings, on mobile money — and Kenya is the obvious place to build it.
- This isn’t new. Egypt’s marriage costs were measured at 4.5× income per person back in 1999 — the currency crisis amplified an old structure, it didn’t create it.
- Africa isn’t alone — just steeper. India runs a $130bn wedding economy at ~5× income per person. The US spends ~5 months of income. Africa runs Indian-intensity ceremonies on far less income, with thinner safety nets.
Section 10Conclusion: Two Rooms, One House
The Living Room is not the enemy. It insures, it signals, it belongs — weddings and funerals are institutions, not extravagances. But the verified numbers still say what they say: in nine of ten of Africa’s biggest economies, status spending beats wealth-building by 1.4 to 6 times.
The fix is not to shrink the Living Room. It’s to grow the Bedroom next to it: save ahead for the ceremonies you know are coming (South Africa’s burial societies already prove it works), put savings on mobile-money rails where people actually are, and let a new definition of status take root — one already visible among younger Africans — where the flex is the title deed, not the guest count.
The Living Room costs you months. The Bedroom builds you years. Both rooms belong in the house — the question is which one you furnish first.
Method & sources: original analysis compiled from World Bank Gross Savings and Global Findex data, Numbeo property indices, Cowrywise, CalcMoney, JanaTribe, GeoPoll, BMC/NBER funeral-cost research, UNESCO/UNICEF education financing data and national wage aggregators (full 39-source reference list in the PDF). Independently fact-checked by Africa Global Forum against primary sources, July 2026 — verification annex included in the PDF edition. Companion reports: The Price of “I Do” and Africa Is Under-Processed.
The diaspora helps the diaspora.
Africa Global Forum is a peer network for Africans abroad — help each other, sit together, and bounce ideas. The research above is part of an open library. The Forum itself is by application.